
At tools4dev we get a lot of emails from people who want to make a monitoring and evaluation (M&E) system for their program, but don’t know where to start. If that sounds familiar then this guide is for you.
What is an M&E system?
As with many things in international development, the precise definition of an M&E system varies between different organisations. In most cases an M&E system refers to all the indicators, tools and processes that you will use to measure if a program has been implemented according to the plan (monitoring) and is having the desired result (evaluation).
An M&E system is often described in a document called an M&E plan. An M&E framework is one part of that plan.
Not sure how to write an M&E framework?
Complete our 1 hour eLearning module
Know your program
Before you start work on the M&E system it’s important that you understand as much as possible about the program itself. You need to know why the program was created, what the goals are, and how the goals will be achieved. You also need to know what all the activities, outputs and outcomes are. This information should be available in documents such as the program logframe, problem tree and/or theory of change.
Choose your indicators
The first step is to decide which indicators you will use to measure the success of your program. This is a very important step, so you should try to involve as many people as possible to get different perspectives.
You need to choose indicators for each level of your program – outputs, outcomes and goals. There can be more than one indicator for each level, although you should try to keep the total number of indicators manageable.
Each indicator should be:
- Directly related to the output, outcome or goal listed on the problem tree or logframe.
- Something that you can measure accurately using either qualitative or quantitative methods, and your available resources.
- If possible, a standard indicator that is commonly used for this type of program. Using standard indicators can be better because they are already well defined, there are tools available to measure them, and you will be able to compare your results to other programs or national statistics.
- Something that will be useful for decision making to improve the program. There is no point measuring an indicator if the results won’t make any difference to your decisions.
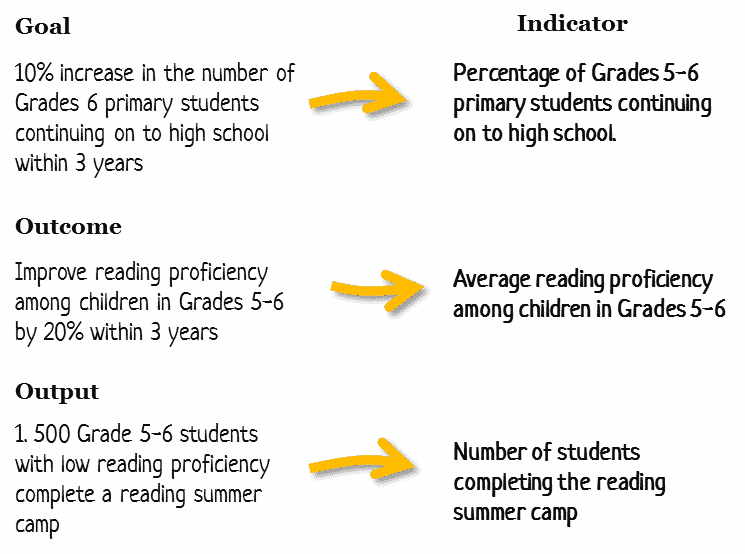
Here is an example of some indicators for the goal, outcome and output of an education program:
Some organisations have very strict rules about how the indicators must be written (for example, it must always start with a number, or must always contain an adjective). In my experience these rules usually lead to indicators that are convoluted or don’t make sense. My advice is just to make sure the indicators are written in a way where everyone involved in the project (including the donor) can understand them.
Define how your indicators will be measured
Once you have chosen your indicators you need to write a definition for each one. The definition describes exactly how the indicator is calculated. If you don’t have definitions there is a serious risk that indicators might be calculated differently at different times, which means the results can’t be compared.
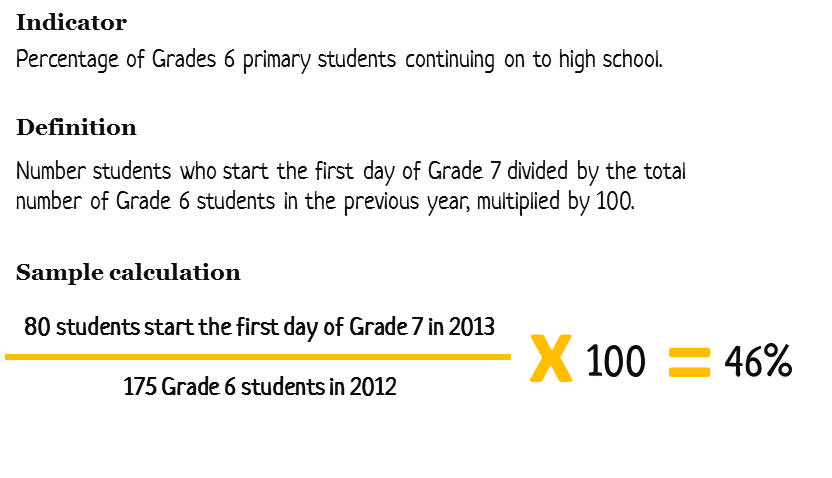
Here is an example of how one indicator in the education program is defined:
After writing the definition of each indicator, you also need to identify how the data will be collected, the frequency (monthly, quarterly, annually, etc.), which tool will be used, where it will be reported, and how quality control will be managed.
It’s a good idea to put all this information in one table for each indicator. An example for one of the education program indicators is shown below.
Sample indicator definition
| Indicator | Reading proficiency among children in Grade 6 |
| Definition | Sum of all reading proficiency test scores for all students in Grade 6 divided by the total number of students in Grade 6. |
| Purpose | To assess whether reading proficiency at the schools participating in the program is improving over time. This would provide evidence on whether the reading component of the program is effective. |
| Baseline | Average score: 47 |
| Target | Average score: 57 |
| Data Collection | The class teacher will conduct a reading proficiency test for all students in the class. Each student will be assessed individually in a separate room. The teacher will ask them to read a list of words, sentences and paragraphs out loud and will mark each one that they have difficulty with. Any students not present on the day of the assessment will be excluded. |
| Tool | National Reading Proficiency Assessment questionnaire |
| Frequency | Every 6 months |
| Responsible | Teachers |
| Reporting | The individual score for each student will be reported in the six monthly progress reports submitted by each teacher to the Program Manager. The Program Manager will then combine the data from each class to create full list of students and their scores. This will be used to calculate the average score for all students in Grade 6 using the definition above. The average score will be included in the report for the donor submitted every six months. |
| Quality Control | All teachers will attend a one day training course on how to complete the assessment. To verify the accuracy of the test scores submitted by the teachers the Program Manager will randomly select one class every six months to audit. This audit will involve re-testing all the students in the class and comparing the results to the results submitted by the teacher. |
Find or create the tools to measure the indicators
When defining your indicators you will need to identify which tool will be used to collect data on that indicator. Common tools include check-lists, forms and surveys.
Wherever possible you should use or adapt existing tools that are known to work. For example, if one of your indicators was poverty then you could use the Progress Out of Poverty Index to measure that. Alternatively, if your indicator was the quality of life of vulnerable children then you could use the Parenting Map.
Even if you try to use as many existing tools as possible, there will still be some indicators where you need to create your own tool. For advice on how to do this see the following tools4dev articles:
- How to write awesome survey questions
- How to pretest and pilot a survey questionnaire
- How to design survey forms for quick data entry
- How to do great semi-structured interviews
- How to write a supervision checklist
Define responsibilities, data flow and data management
After creating the tool for each indicator you need to decide who will be responsible for each step in the process. This includes who will be responsible for using the tool to collect the data, who will enter the data into the computer, who will analyse it and who will crate the final report.
I often find that it’s useful to create a flow chart (like the one below) showing how the data will flow from the point where it is collected up to the final end user.

You will also need to consider how all the data from the indicators will be managed. This includes where it will be stored (on a computer, in hard copy files, in a database, etc), what software will be used to analyse it, and how privacy will be maintained.
Put everything into the M&E plan template
Once you have completed all the previous steps you need to write up everything in one document. This document is often called the M&E plan, but it can also be called the M&E procedures, M&E standard operating procedures (SOP), or M&E system documentation. Regardless of the name the content is usually similar. If you prefer to have it all available online then you could also upload it to an Aid Information Management System (AIMS).
On tools4dev we have an M&E plan template that you can use as a starting point.
Download the M&E Plan template (one project) Download the M&E Plan template (multiple projects)
After filling out all the sections of this template you are now ready to implement your M&E system following the plan you have created.
Photo by Bill Bradford