

Surveys are a common activity in international development. Although mobile phones and tablet computers are becoming more common, these days most surveys are still done on paper. This means that someone in the organization will need to enter all the completed surveys into the computer for data analysis.
This guide explains how to design the survey form to make the data entry process as easy and quick as possible. Following the steps listed here can improve the accuracy of the data entry, and can also save time and money (if you’re paying other people to do the data entry). The inspiration for many of these tips comes from The Survey Research Handbook by Pamela Alreck and Robert Settle.
This advice is for:
- Basic surveys such as feedback forms, needs assessments, simple baseline and endline surveys etc.
- Sample sizes in the hundreds.
- Surveys completed on paper.
- Written surveys completed by individuals who are literate.
This advice is NOT for:
- Complex baseline and endline surveys or research studies.
- Sample sizes in the thousands.
- Surveys completed online or on a mobile.
- Graphical surveys completed by people with low literacy.
Add numbers for all questions and answers
Once you’ve written all your questions, the first step to make the form easy for data entry is to add question and answer numbers. To explain why, here’s an example of a typical question from an international development survey:
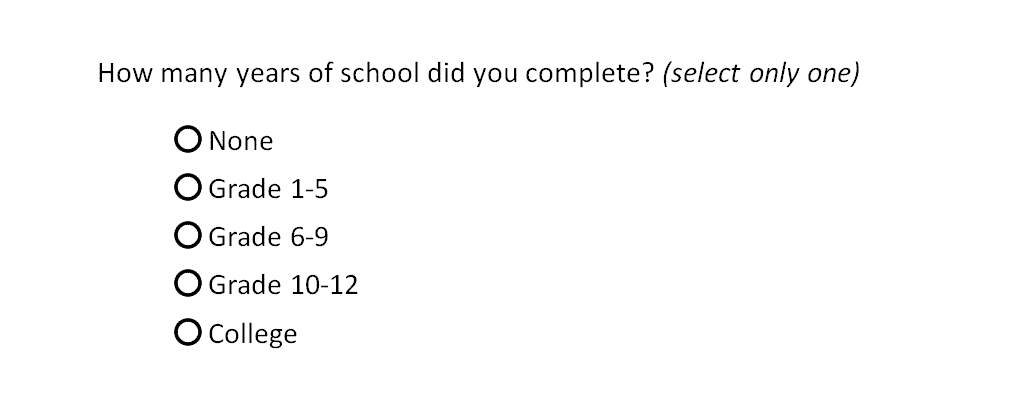
There are two problems with this question from a data entry perspective. The first is that there is no question number, so the person doing the data entry won’t know which question they are up to. The second problem is that in order to enter the answer into a spreadsheet you would need to type out the full answer (e.g. “Grade 1-5”). These two problems can be easily solved by adding numbers:
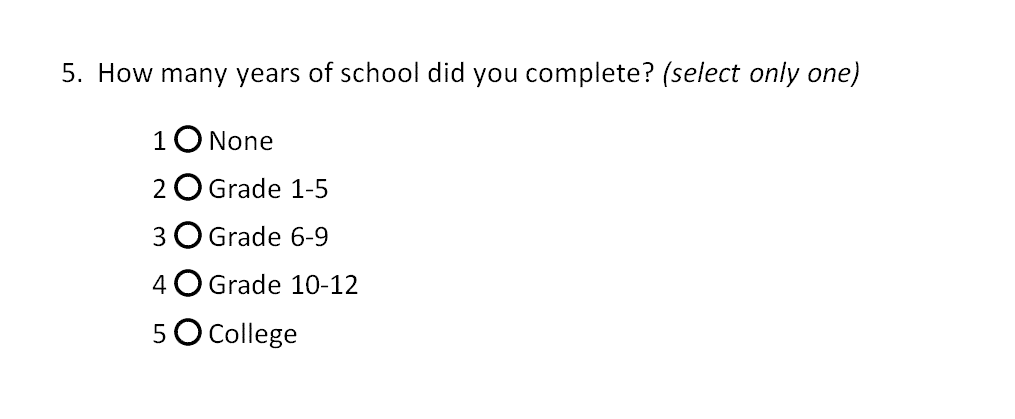
Now instead of entering the whole answer into the spreadsheet, you only need to enter the answer number (e.g. “2” instead of “Grade 1-5”). This is a lot faster because it takes fewer keystrokes. Another major benefit of numbering comes when you need to translate the survey. Below is the question translated into Khmer, the national language of Cambodia.

Now, even if you don’t speak Khmer you can still help with data entry because you only need to enter the answer number. You can also check the accuracy of the data entered into the spreadsheet without needing to read the survey questions. This is particularly important in international development where it’s very common to have multilingual teams, in which some team members can’t read the survey language.
All these benefits are lost if the numbering is translated. Not only does this cause problems for team members who can’t read the language, it can also cause problems for team members who can read the language. For example, in this case the Khmer numbers are completely different to the numbers on the keyboard. So even if the person doing data entry can read Khmer, they will still waste time mentally translating the numbers before they can enter them.

If the survey participants are likely to be confused or distracted by the numbering you can do it in small, light grey lettering. That way most people are likely to ignore it, but it’s still useful for doing data entry.

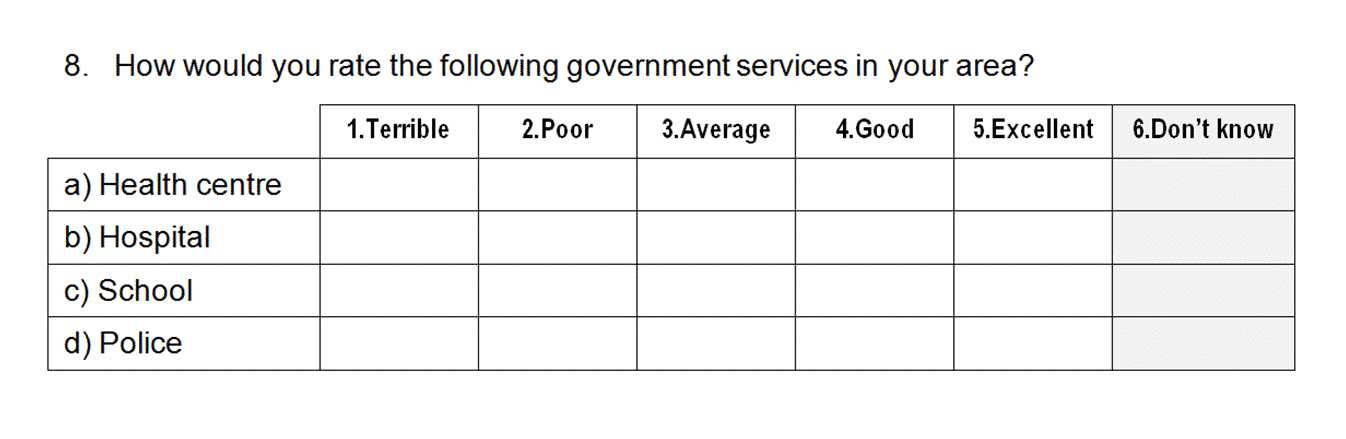
It’s important to put question and answer numbers on all the questions in the survey. Below is an example of a rating scale where the letters a), b), c) etc are used to identify the sub-questions, and the numbers 1-6 are used for the rating at the top. Simple yes/no questions should also be given numbers. “Yes” is normally given the number 1 and “No” is also given the number 2.
Use circles for select one and squares for select all
Once all of the questions and answers are numbered, the next step is to make sure that questions with only one answer use circles and questions with more than one answer use squares. Below are examples of each type:
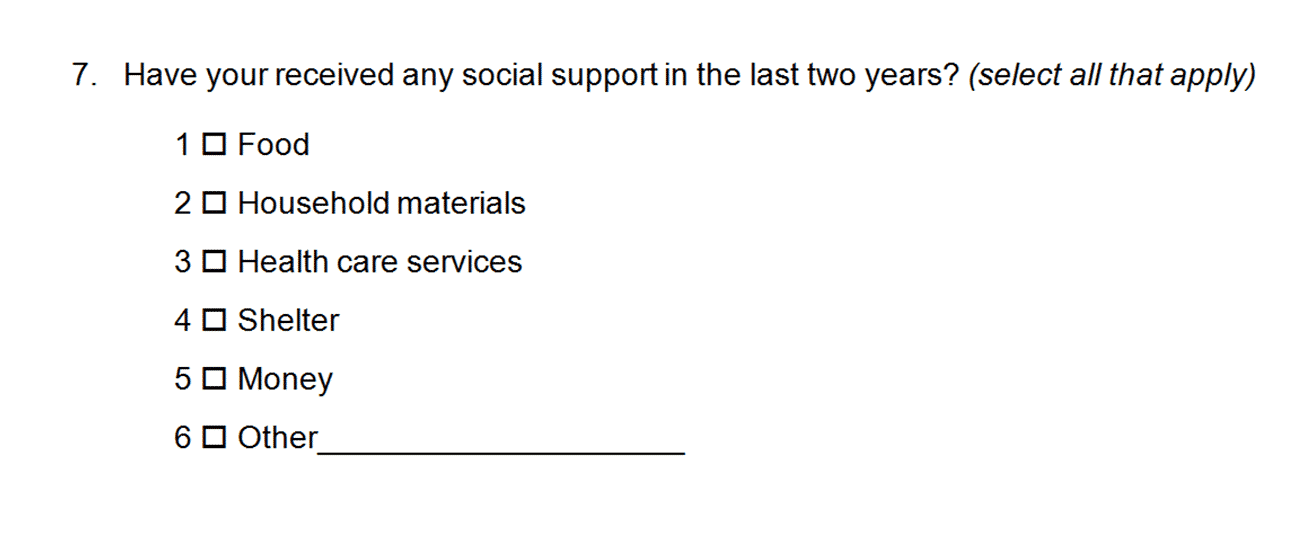
Using different shapes for different questions helps both the person completing the survey and the person doing the data entry. It reminds them how many answers are allowed for each question. Circles and squares are becoming the the standard shapes because of radio buttons and check-boxes used in computer programs and online surveys.
Separate and align questions using formatting
The next step is to format the survey. The aim of formatting is to clearly separate the questions, and make sure that all the answers are aligned. Below is an example of a well formatted survey:
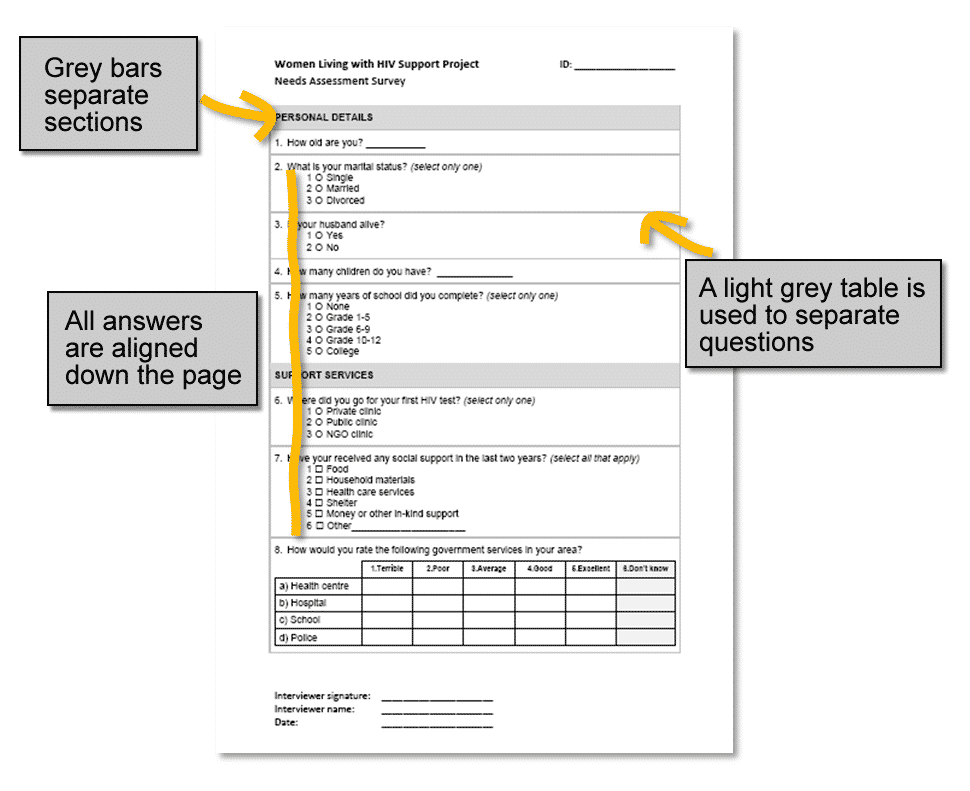
Aligning the answers down the page means the person entering the data only needs to look in one place for the answers. It also makes the person completing the survey less likely to accidentally skip questions.
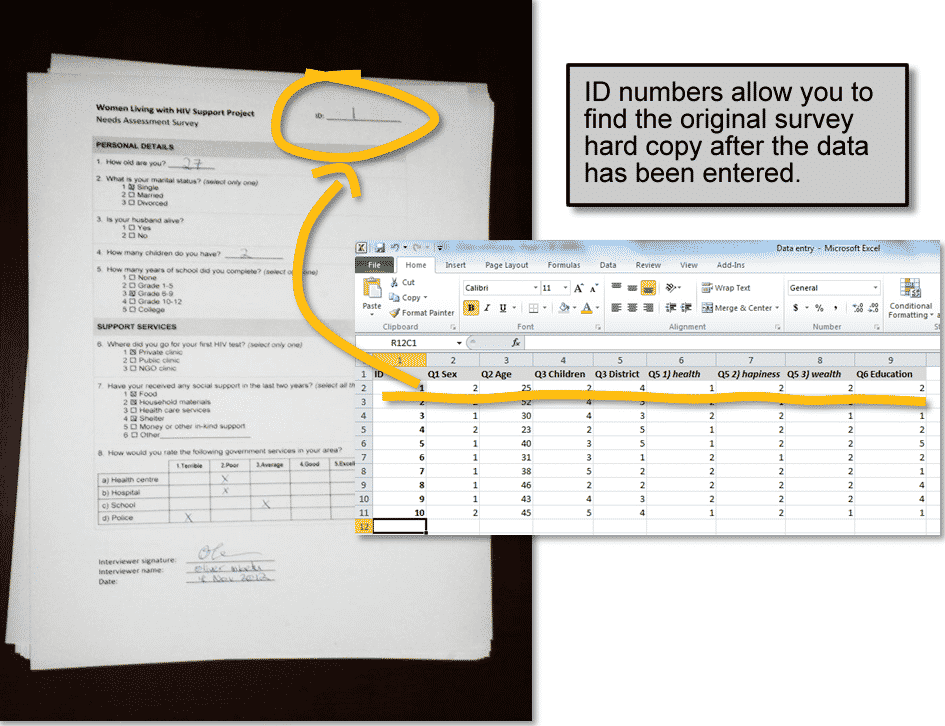
Add space for an ID number
Space for an ID number should be added to the top right corner of the survey, on the first page. This is a unique number that identifies each survey. If you’re printing lots of surveys this can often be done by the print shop. However, most of the time the surveys will just be printed on a regular printer and then photocopied. In this case you can handwrite the ID number on each survey once it is returned to you for data entry. Start with 1 on the first survey, 2 on the second, and so on, up to however many surveys you have.
Once you put the ID number on the surveys it’s very important that you file the surveys in that order. That way if you identify any errors in the data you can easily find the original hard copy of the survey just by looking up the ID number.
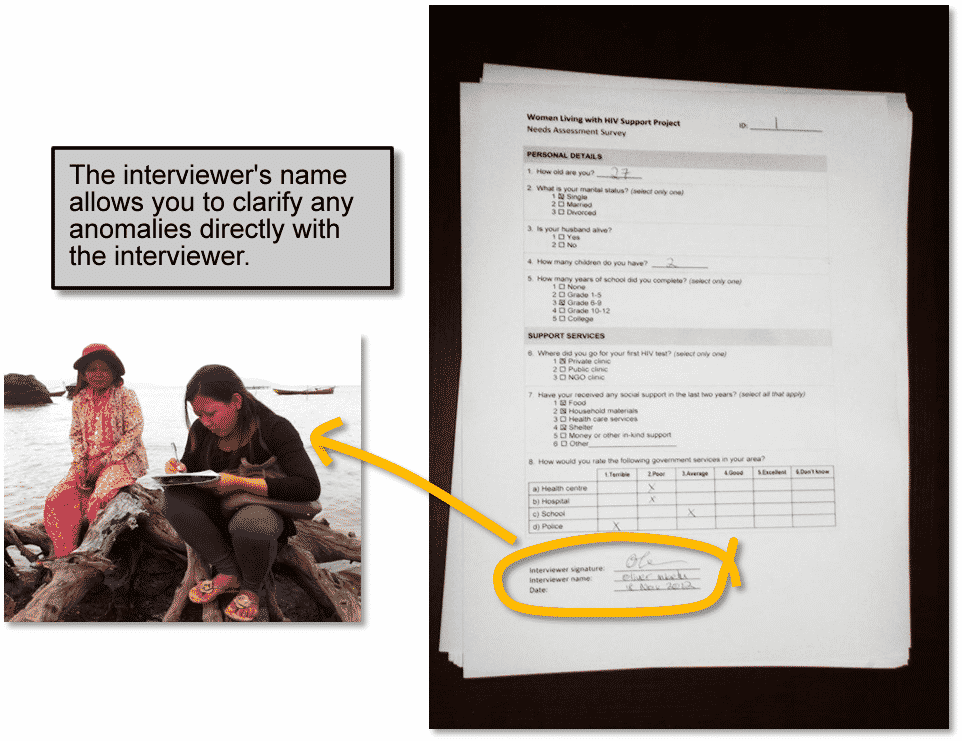
Add space for the interviewer’s name and signature (if there is one)
If the survey is being completed by interviewers, rather than directly by participants, then space for the interviewer’s name, signature and date should be added at the end of the survey. This allows you to identify the interviewer if there are any errors with the data. In many countries signed documents are also considered more “official” than unsigned ones. So having the interviewer sign the completed survey can help motivate them to make sure all the answers are recorded correctly.
Don’t print double sided (unless it’s a booklet)
When your survey is ready for printing make sure you only print single sided. The problem with printing double sided is that it’s very easy to completely miss the other side of the page. This can leave you with a pile of half-completed or half-entered surveys. The only exception to this rule is if you are printing the survey as a booklet, in which case it is fine to print on both sides. In fact, if you have the ability to print as a booklet then that’s usually the best format to use.
Use a basic spreadsheet in the software you feel most comfortable with
Once the surveys have been printed, completed and returned, you are now ready to start data entry. Some people think you need to use a fancy statistical package like SPSS or EpiInfo to enter your data. The reality is that for most basic surveys done in international development it is perfectly acceptable (and even recommended) to enter your data into a basic spreadsheet. The spreadsheet can be in whichever software you feel most comfortable with, whether that’s Microsoft Excel, Google Spreadsheets, or any other program (even SPSS or it’s free cousin PSPP if you prefer that).
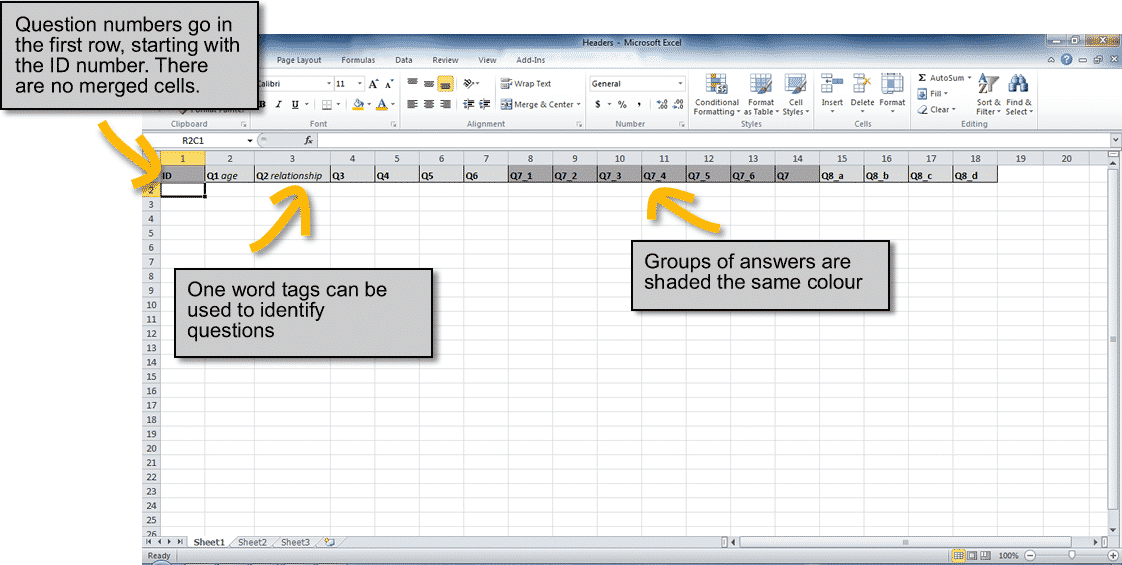
Put the question numbers in the first row, and shade groups of questions
Before entering any data you need to put the question numbers at the top of the spreadsheet. The header row should only take up the first row of the spreadsheet (not two or three rows). You should only enter one question number into each cell, and none of the cells should be merged. This is important because later on we will use a filter to check the data, and if there are merged cells the filter won’t work.
For questions that have multiple answers you will need to have one column per answer (e.g. Q7_1, Q7_2, Q7_3, etc). You can shade the header row another colour to make it stand out, and it’s also good practice to shade groups of questions (or groups of answers from multiple answer questions) in different shades. If you want to remember which question number goes with which question on the survey you can add short labels to each header (e.g. Q1 age, Q2 relationship, etc).
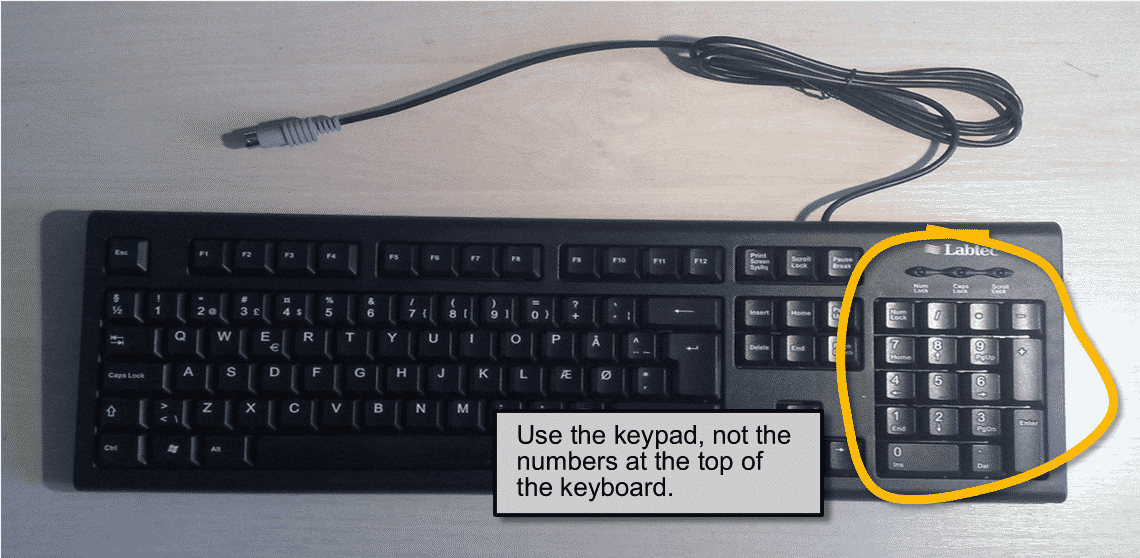
Use a keypad
You’re now ready for data entry. Data entry should only ever be done using a keyboard with a keypad. This is important because your hand is able to sit easily over the keypad and reach all of the numbers without moving your wrist. If you use the numbers at the top of the keyboard it will be slower, and you could get a repetitive strain injury from moving your hand around too much. If you’re using a laptop without a keypad you can purchase a stand-alone keypad that will plug into the USB port.
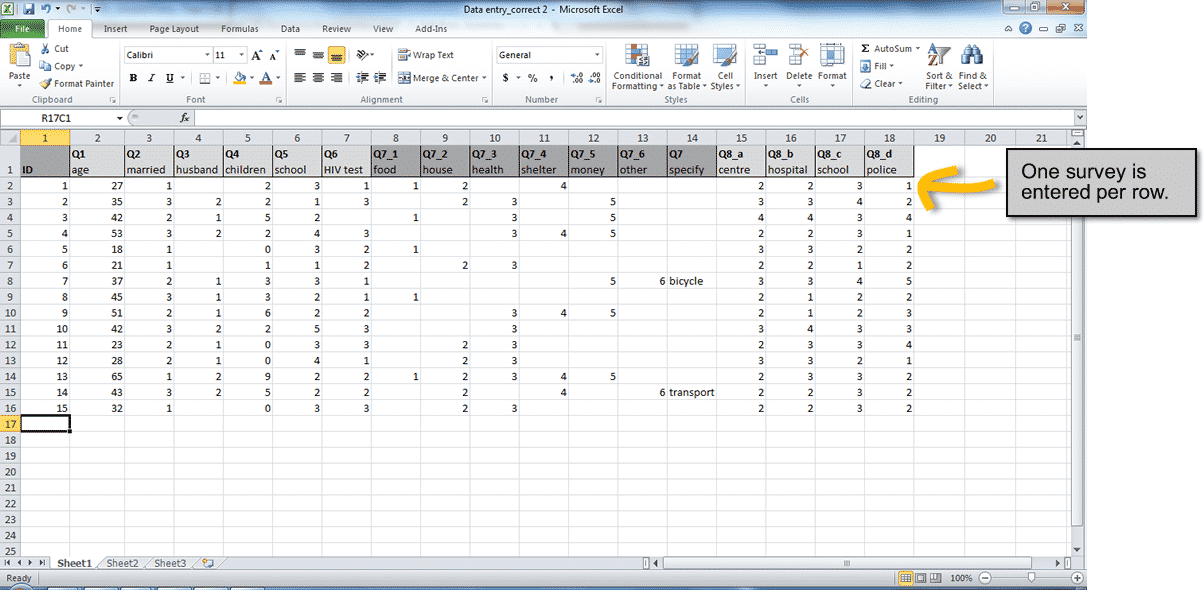
Enter one survey per row
Now all you need to do is enter one survey per row into the spreadsheet. As discussed in Step 1, you only need to enter the numbers, not the whole answers. Below is an example of some data that has been entered into the spreadsheet. You should backup your spreadsheet regularly throughout this process, and also before moving on to the next step.
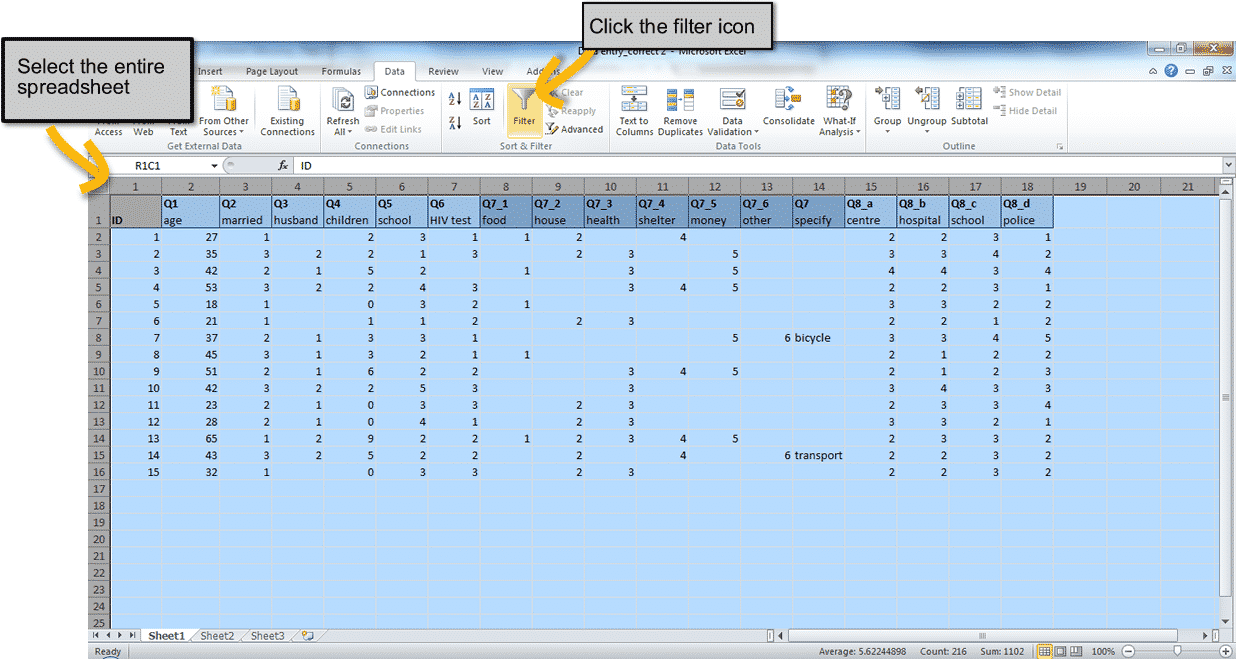
Check the data using a filter or sorting
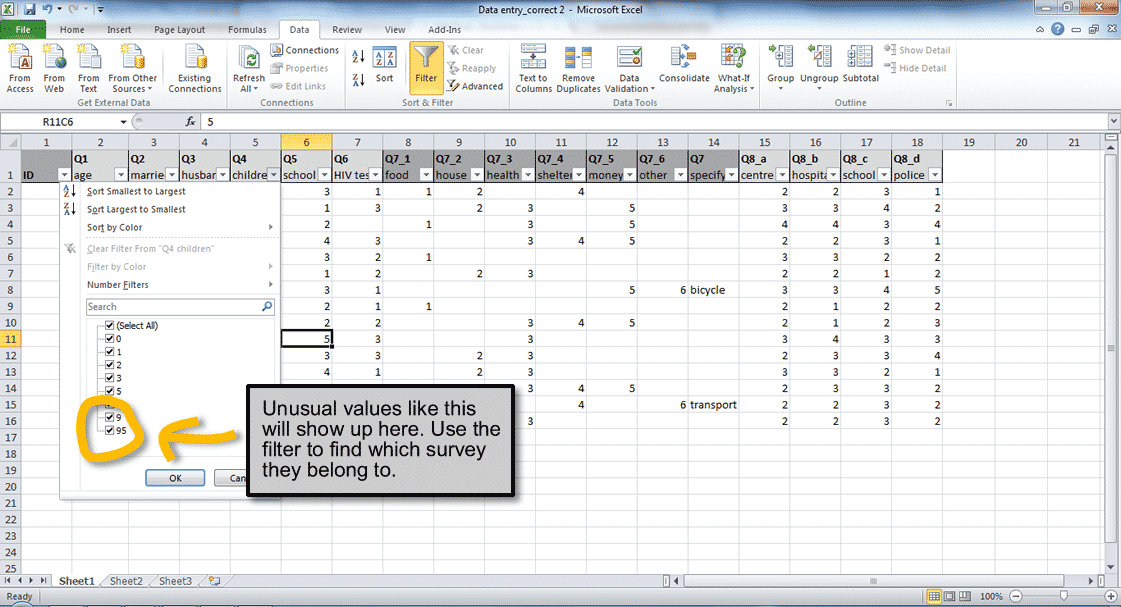
The next step is checking the data for unusual numbers. To do this in Excel select the entire spreadsheet, got to the “Data” tab and click the large “Filter” icon. This will bring up small button at the top of each column. If you click on one of the buttons it will show you which values have been entered into that column. You can also filter and sort by particular values (for a demonstration of this see the video version of this guide).
This method will allow you to check that each column only contains values that actually make sense. If there is a value that doesn’t make sense (e.g. a 95 in the column for “number of children”) you can use the filter to find out which survey that usual value belongs to. You can then find the original hard copy of the survey using the ID number, and the name of the interviewer will also be on the survey so you can check with them if necessary.
It’s also good practice to randomly select 10% of all the surveys and check them against the hard copies. Once all the data has been checked make sure you save a backup before starting the analysis.
Find and replace the numbers (optional)
Once you start the analysis sometimes it can be useful to find and replace the numbers with the text values from the survey. For example, replacing answers 1, 2 and 3 with the text values “Single”, “Married” or “Divorced”. You can do this by selecting the column you want to change and doing a “Find and Replace” for each of the numbers.

How much time does this really save?
After all this, you might be wondering how much time this method actually saves. We tried entering 15 one page surveys that didn’t used any of the steps in this guide, followed by 15 that used all the steps. It took only 4min 42s to enter the surveys that used all the steps (that’s 19s per survey) compared to 7min 53s for the surveys that didn’t use the steps (32s per survey). So if you follow all the steps in this guide you could potentially cut your data entry time almost in half.