

Once you’ve written some good survey questions following the tips in Part 1, the next step is to write good answers for people to choose from. This guide provides tips on how to create the three most common types of survey answers – numerical, multiple choice and scales – in a way that improves accuracy and reduces bias.
Numerical answers
A numerical answer is one where the person completing the survey is able to write an exact number. For example “How old are you? _____ years”.
Avoid grouping numerical answers into ranges
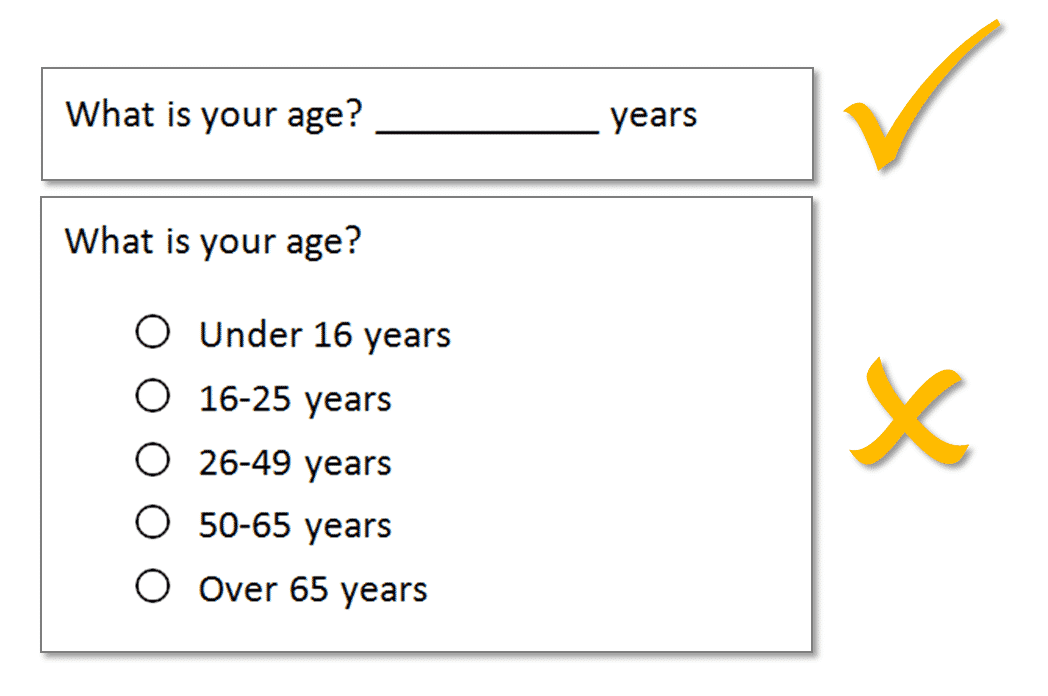
Numerical answers are the most accurate, and can be used in the widest range of analysis, so you should always use numerical answers whenever it is possible to do so. Don’t group numerical answers into ranges unless you have to. In the example below, it’s much better to ask for their exact age, rather than asking them to select from a range. If you ask for their exact age you can always group it later during the analysis, but if you ask for a range then you can’t un-group it.
Of course, sometimes it’s not possible for participants to remember the exact number, or they might not want to give it to you. For example, if you ask about a person’s income they might not want to tell you the exact amount, and so in that case it might be better to use ranges instead. Or if you want to know how many hours they spent doing laundry in the last week they probably won’t be able to remember the exact number, and so you could use a range. But only do this if you absolutely have to.
Use units that people will understand
It’s also important to carefully consider the units used for the numerical answer. You should use the most common units that the target group uses. For example, if the target group uses feet rather than meters to measure height then you should use those units. It’s also important to consider how small the units are, as people can have difficulty remembering detailed numbers. For example, people are more likely to remember how many hours they spent yesterday watching TV, rather than exactly how many minutes.
Multiple Choice
A multiple choice question allows the participant to select an answer from a range of pre-determined options.
Give clear instructions
All multiple choice questions should have instructions on whether the person responding should select only one answer or more than one answer. These instructions are usually placed under the question in italics, or a different font, to make them stand out (see the example in the following section). You should also use the question wording to help remind people how many they should choose. For example, you could ask “Which one of the following TV shows is your favourite” rather than “Which of the following TV shows is your favourite”.
A maximum of 10% of answers should fall into “other”
When creating multiple choice options it’s important to provide a range of options that will capture the majority of answers. In general, 90% of people’s answers should fall into the options that you have provided. That will leave around 10% of answers in the “other” category. If you have more than 10% of answers in “other” category that’s a sign that you haven’t selected the right options for your multiple choice question.
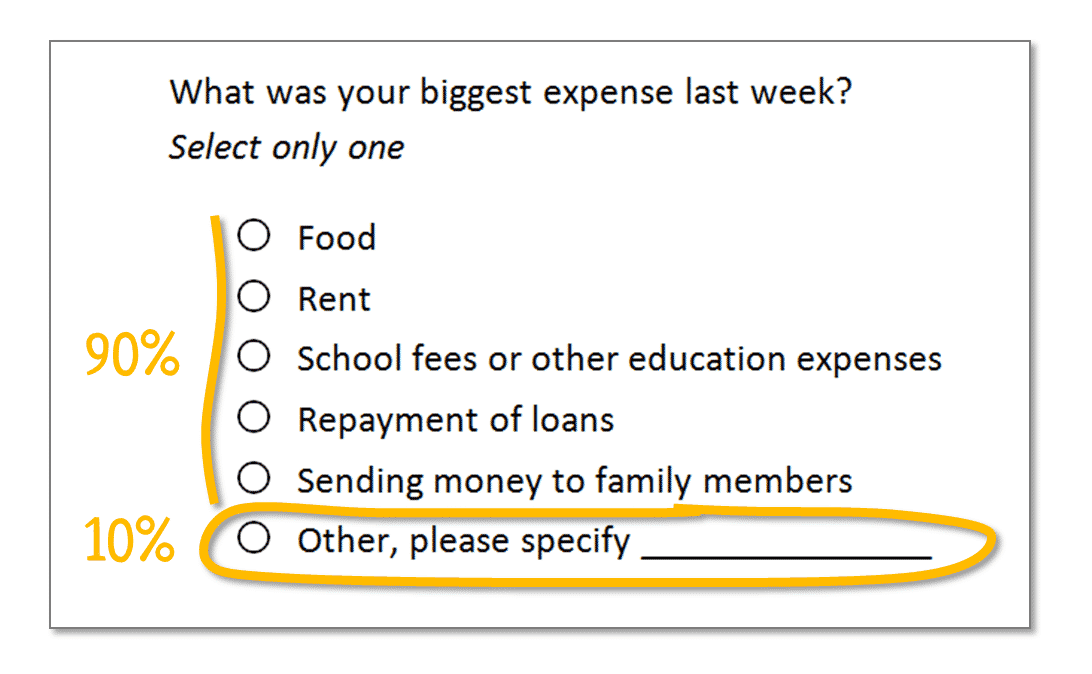
You should always include space for the participant to write what the “other” was. That way if a lot of people give the same “other” item you can group them together during analysis to form a new category.
Use a focus group or interviews to create the options
Sometimes it can be difficult to know which options to include as answers to a multiple choice question. If you choose the wrong options you can end up with more than 10% of responses in “other”, which makes things more difficult to analyse.
The best way to create options for a multiple choice question is to do a focus group or interviews with 8-10 people from your target population. Ask them your survey question as an open ended question and see how they respond. Then group their answers together to create the options for the multiple choice answers (see example below).

Options should be narrow and should not overlap
Two common mistakes with multiple choice questions is to create options that overlap, or are too broad. In the example below parents are asked what school materials their child has. If their child has pens and pencils they could select the “pen or pencil” option, or they could select the “exercise book and writing materials” option as pens and pencils are also writing materials.
Not only is this confusing for the person responding, it also makes the analysis extremely difficult as parents whose children have pens and pencils could have chosen either option.

The correct version of this question (shown below) separates out each of the items and doesn’t have any overlap between the options. If in doubt, make the options more narrow (separated into smaller items) since they can always be combined into larger groups later during the analysis.

Put the options in a random order if possible
People are significantly more likely to remember the first and last items in any given list. This can bias people’s answers to multiple choice questions because they are more likely to select the first and last options. This is particularly true for surveys completed verbally because the participant has to hold the entire list in the memory before choosing an option.

One way to address this problem is to make the order of the options random. This is very easy to do if you are conducting an online survey, as many online survey providers allow you to randomise the order of answer options. It is also possible to do if you are conducting verbal interviews with trained interviewers. However, it is difficult to do on a printed survey which the participant completes themselves – unless you are able to print multiple different versions.
Limit the number of options
Another way to minimise the bias caused by people remembering the first and last options more is to keep the number of options on the list to a minimum. Psychology research shows that people have difficulty remembering more than 4-5 items at a time, so for verbal surveys you should keep the options to this number.
For written surveys people have the list in front of them, and can read over it again before answering. So for those surveys it is possible to have 6-8 options before this type of bias becomes a major concern. If you do need to include more than this maximum number of options then it is better to break them into separate questions – for example by using multiple rating scales to rate each item rather than having them in one multiple choice question.
Scales
Scales allow the participant to rate a range of different items on one dimension, such as how important they are, how frequent they are, or how much they agree with them. The example below shows how using a scale can allow you to compare the importance of different environmental issues for participants.

Label all points if participants are not familiar with scales
One of the major problems with using scales in international development is that the target audience for the survey may not be familiar with how to complete a scale. I once used a 5 point scale as part of a feedback questionnaire for rural women in Cambodia. The women had never encountered a scale before, and had no idea how to complete it. As a result most of the data collected was unusable.
There are two things you can do to address this problem. One is to consider how many points on the scale are labelled. Normally, when the target audience is familiar with using a scale, it’s much better to label only the first and last point (see example below). People who are familiar with scales understand that each number on this scale represents one option, and because the numbers are evenly spaced you can do a wider range of analysis on the results.
However, if people are not familiar with scales it might not be clear to them what each number actually means. To make this clearer you can label each number with a description (see example below). This will make the scale easier to use, although it does limit the types of analysis you can do on the results.

To make things even easier for participants who are not used to scales, you could also format the question in the same way as a multiple choice question. People are often more familiar with this type of question structure, although the downside is that it takes up more space on the form.

Write the labels and numbering in the local language first
As discussed in Part 1 of this How To Guide, you should always try to write the questions in the local language first, and then translate it into any other languages that may be required, such as English. This is particularly important for the labels and numbering on a scale.
Each end of the scale must be the opposite of the other (see examples below). If you write the labels in English and then translate them directly into the local language the resulting labels may not be exact opposites, which means the scale will not be accurate.

The ordering and direction of the numbering should also be decided based on the conventions in the local language. In some languages the number 1 as associated with “more” or “higher”, while in other languages the number 10 is associated with “more” or “higher”. Whether you start with 1 on the left or right also depends on the local language, so this should all be done in the local language before being translated. If writing the scales in the local language is absolutely impossible then you can use back translation as an alternative.
Use more numbers to measure a smaller difference
A common question with scales is how many numbers should be on the scale, for example should it go from 1 to 5 or 1 to 10? If you need to label every point on the scale then you should normally limit it to around 5 points, otherwise it will be difficult to write descriptive labels for each number.
However, if your target audience are familiar with scales then you only need to label the first and last number and can have as many numbers in between as you want. In this case it’s better to have 8-10 numbers, particularly if you think people will only have a small difference of opinion on an issue and you need to measure those differences.
Only use odd numbers when people have no opinion
There a lot of debate about whether a scale should have an even or odd number of points. If you have an odd number of points, such as 5, 7 or 9 then this allows for a “neutral” position (see example below). You should only use an odd number of points if you think the person answering might actually have no opinion on the topic.
For example, the question below asks whether they think the new product packaging is better than the old product packaging. It’s entirely possible that the person answering has no opinion on this, or thinks that both the new and old packaging are the same, and so you should allow a neutral option. If you don’t allow for a neutral option the person answering might resent being forced to make a choice one way or the other.

However, if you think that most people do have an opinion, but they might not be willing to share it, then you should use an even number of points (see example below). This forces them to go one way or the other and does not allow for a neutral position.
People may be less likely to share their opinion if the topic is controversial, such as the example below which asks about whether same sex couples should be allowed to marry. In this case it’s better to force them to choose one way or the other. People may also avoid choosing a side if they have an opinion, but it is not a very strong one, in which case they might “fence sit” and choose a neutral position instead.

Once you’ve written your survey questions the next thing you need to do is put them together into a questionnaire form, and then pretest and pilot it.
Photo by albertogp123